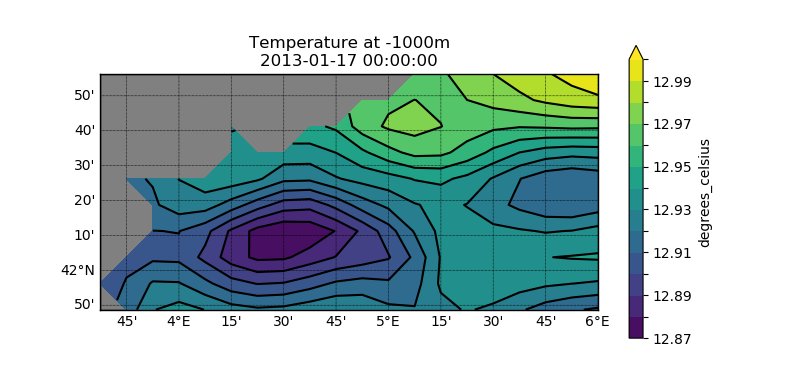
3.5.13.15. test_dataset_plot_hsection_mfs.py – Test plot_hsection() with MFS

"""Test :meth:`~vacumm.data.misc.OceanDataset.plot_hsection` with MFS"""

# Inits
ncfile = "mfs.nc"
depth = -1000.

# Imports
from vcmq import DS, data_sample, os, code_file_name

# Setup dataset
ds = DS(data_sample(ncfile), 'nemo', logger_level='critical')

# Plot hsection
figfile = code_file_name(ext='png')
if os.path.exists(figfile): os.remove(figfile)
ds.plot_hsection('temp', depth, savefig=figfile, fill='contourf', show=False, close=True)
