# -*- coding: utf8 -*-
"""Plot a PREVIMER curve"""
import matplotlib
matplotlib.use('agg')
from matplotlib.dates import HourLocator
# Some params
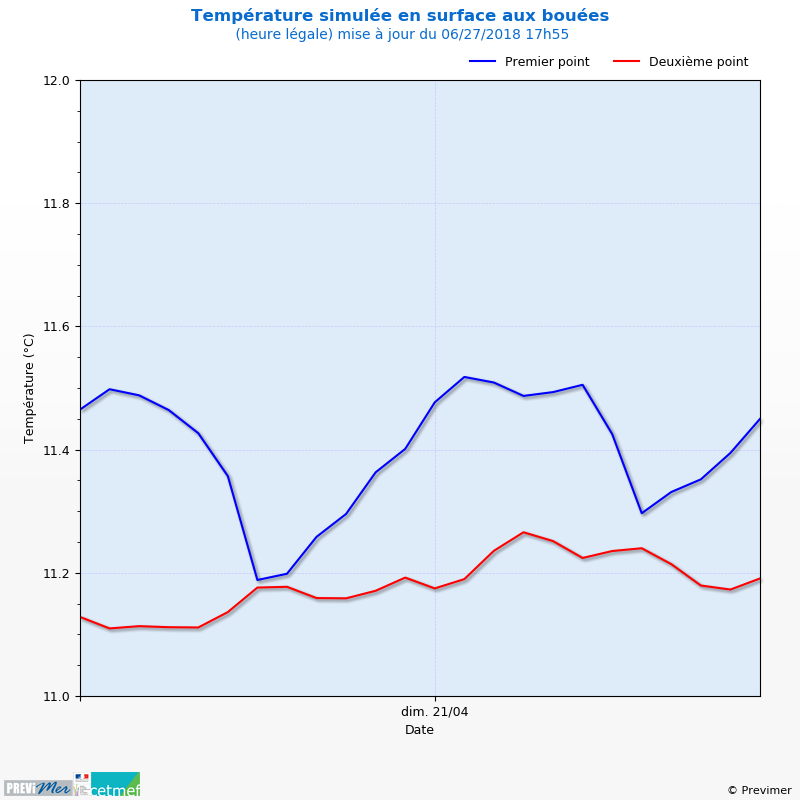
field = 'sst'
ncpat = "mars3d.botop.%Y%m%dT%H00Z.nc"
ndayfore=3
nowtime = "2013-04-21 06:13"
logofile = "logo2_previmer_cetmef.png"
copyright = u"© Previmer"
# Imports
from vacumm.report.ifroco.curves import (round_date, P, DS, paris_to_utc, now, os,
cfgget, N, grid2xy, plot_curves, cdtime, utc_to_paris, Day12hFormatter,
load_cfg)
from vcmq import data_sample, code_file_name
# Time
#t0 = round_date(now(utc=False), 'day', 'floor')
t0 = round_date(nowtime, 'day', 'floor')
t1 = t0.add(ndayfore, cdtime.Day)
t0 = paris_to_utc(t0)
t1 = paris_to_utc(t1)
# Read
ds = DS(data_sample(ncpat), 'mars', time=(t0, t1), logger_level='critical')
data = ds.get(field)
utc_to_paris(data)
# Read some config values
cfgfile = code_file_name(ext='cfg')
load_cfg(cfgfile)
long_name = cfgget('long_name', field)
long_long_name = cfgget('long_name_model', field)
units = cfgget('units', field)
vmin = cfgget('vmin', field)
vmax = cfgget('vmax', field)
points = cfgget('points', field)
# Interpolate to points
lons = N.array([d[0] for d in points])
lats = N.array([d[1] for d in points])
ptdata = grid2xy(data, lons, lats)
datas = []
for i in xrange(ptdata.shape[1]):
datas.append(ptdata[:, i])
datas[i].long_name = points[i][2].decode('utf8')
# Plot
logofile = os.path.join(os.path.dirname(code_file_name()), logofile)
x = plot_curves(datas, vmin=vmin, vmax=vmax, units=units, long_name=long_name,
title=long_long_name+u' aux bouées', logos=logofile, copyright=copyright,
date_locator=HourLocator(byhour=[0, 12]),
date_formatter=Day12hFormatter('%a %d/%m'),
hlitvs_units='day',
savefig=code_file_name(ext='png'),
# ylocator=MaxNlocator(integer=True), yminor_locator=MaxNlocator(integer=True, steps=2),
close=True
)
#P.show()