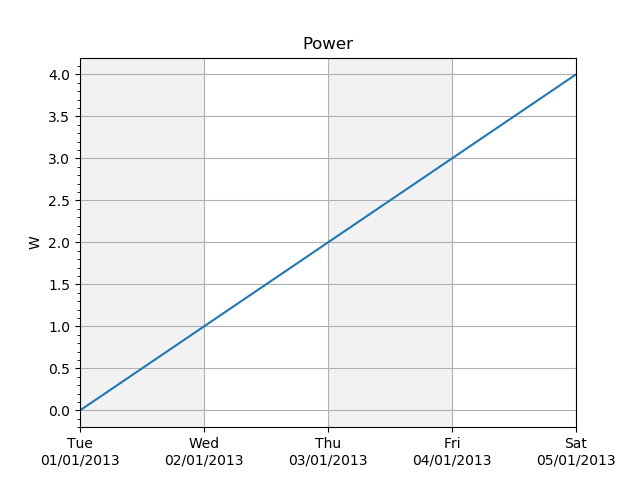
3.5.3.9. test_plot_hlitvs.py – Test curve2() with a call to hlitvs()
"""Test :func:`~vacumm.misc.plot.curve2` with a call to :func:`~vacumm.misc.plot.hlitvs`"""

# Imports
from vcmq import MV2, code_file_name, os, code_file_name, curve2

# Init
var = MV2.arange(5.)
var.units = 'W'
var.long_name = 'Power'
axis = var.getAxis(0)
axis.units = 'days since 2013-01-01'
axis.long_name = 'Time'
axis.axis = 'T'


# Plot
figfile = code_file_name(ext='png')
if os.path.exists(figfile): os.remove(figfile)
curve2(var, savefig=figfile, show=True, close=True, hlitvs=True)