"""Test :func:`~vacumm.misc.plot.plot2d` with a time axis"""
# Imports
from vcmq import MV2, code_file_name, plot2d, os
# Init
var = MV2.reshape(MV2.arange(10*8), (8,10))
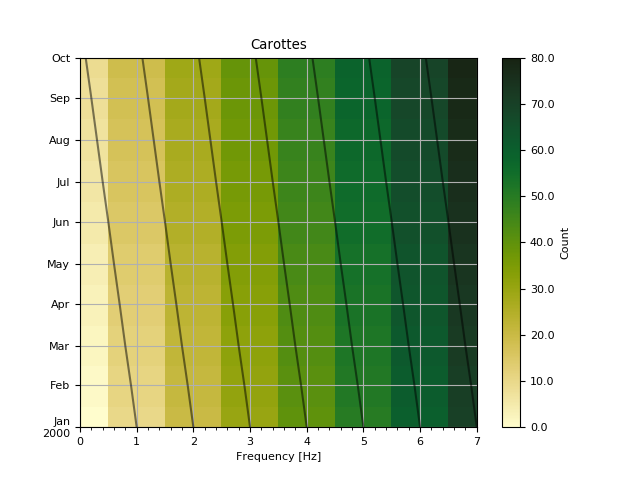
var.units = 'Count'
var.long_name = 'Carottes'
x = var.getAxis(1)
x.units = 'months since 2000'
x.long_name = 'Time'
y = var.getAxis(0)
y.units = 'Hz'
y.long_name = 'Frequency'
# Plot
figfile = code_file_name(ext='png')
if os.path.exists(figfile): os.remove(figfile)
plot2d(var, savefig=figfile, show=False, close=True, fill='pcolor', order='t-')
# Unittest
result = {"files":figfile}