"""Test the fortran function :f:func:`interp1d`"""
from vcmq import N, P,meshcells, minmax, code_file_name, os
from vacumm.misc.grid._interp_ import interp1d
nx = nyi = 10
mv = 1.e20
u, v = N.mgrid[-3:3:nx*1j, -3:3:10j]-2
vari = N.ma.asarray(u**2+v**2)
vari.set_fill_value(mv)
yi = N.linspace(-1000.,0., nyi)
yo = N.linspace(-1200, 100, 30.)
vari[nx/3:2*nx/3, nyi/3:2*nyi/3] = N.ma.masked
x = N.arange(nx)
yyib, xxib = meshcells(yi, x)
yyob, xxob = meshcells(yo, x)
varon = N.ma.masked_values(interp1d(vari.filled(), yi, yo, mv, 0, extrap=0), mv)
varol = N.ma.masked_values(interp1d(vari.filled(), yi, yo, mv, 1, extrap=0), mv)
varoh = N.ma.masked_values(interp1d(vari.filled(), yi, yo, mv, 3, extrap=0), mv)
kw = dict(vmin=vari.min(), vmax=vari.max())
axlims = [x[0], x[-1], yo[0], yo[-1]]
P.figure(figsize=(8, 8))
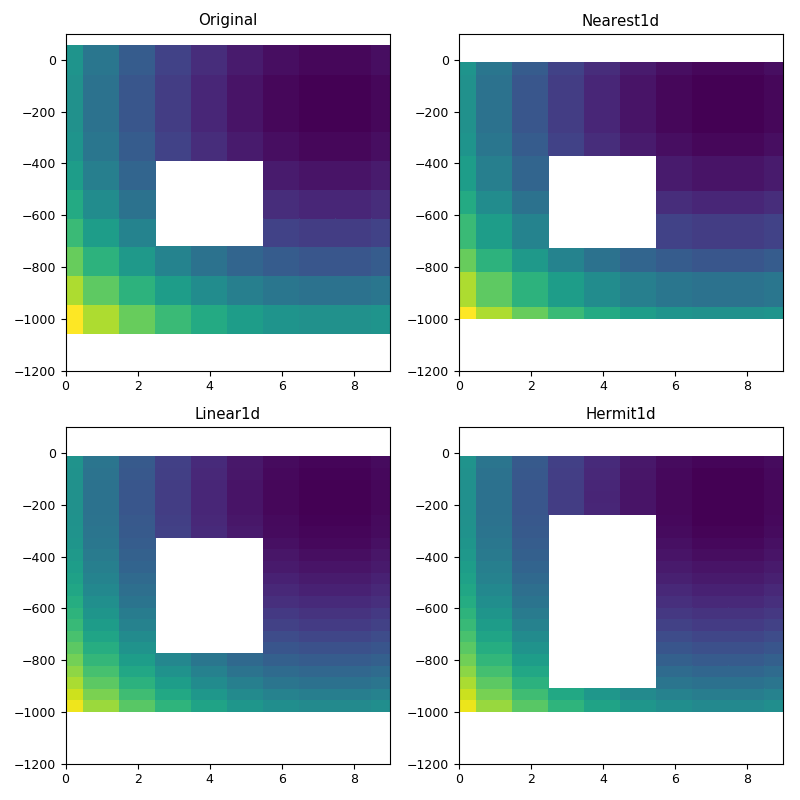
P.subplot(221)
P.pcolor(xxib, yyib, vari, **kw)
P.axis(axlims)
P.title('Original')
P.subplot(222)
P.pcolor(xxob, yyob, varon, **kw)
P.axis(axlims)
P.title('Nearest1d')
P.subplot(223)
P.pcolor(xxob, yyob, varol, **kw)
P.axis(axlims)
P.title('Linear1d')
P.subplot(224)
P.pcolor(xxob, yyob, varoh, **kw)
P.axis(axlims)
P.title('Hermit1d')
P.tight_layout()
figfile = code_file_name(ext='png')
if os.path.exists(figfile): os.remove(figfile)
P.savefig(figfile)
P.close()