"""Test :func:`~vacumm.misc.grid.regridding.transect`"""
# Inits
ncfile = "menor.nc"
lon0 = 3.31
lat0 = 43.19
lon1 = 4.78
lat1 = 42.01
# Imports
from vcmq import DS, data_sample, mixed_layer_depth, N, transect, section2, curve2, code_file_name, os
from vacumm.misc.plot import add_map_lines
# Read data
ds = DS(data_sample(ncfile), 'mars', logger_level='critical')
temp = ds.get_temp(squeeze=True)
dens = ds.get_dens(squeeze=True, potential=True)
depth = ds.get_depth(squeeze=True)
# Compute MLD
mld = mixed_layer_depth(dens, depth=depth, mode='deltadens', format_axes=True)
del dens
# Compute transect
tlons = (lon0,lon1)
tlats = (lat0,lat1)
tlons = N.concatenate([N.linspace(lon0,lon1,100.),N.linspace(lon1,lon1,100.)])
tlats = N.concatenate([N.linspace(lat0,lat1,100.),N.linspace(lat1,lat0,100.)])
xtemp, xlons, xlats = transect(temp, tlons, tlats, getcoords=True, outaxis='dist')
xdepth = transect(depth, tlons, tlats)
xmld = transect(mld, tlons, tlats)
xmld[:]*=-1
# Plot temperature
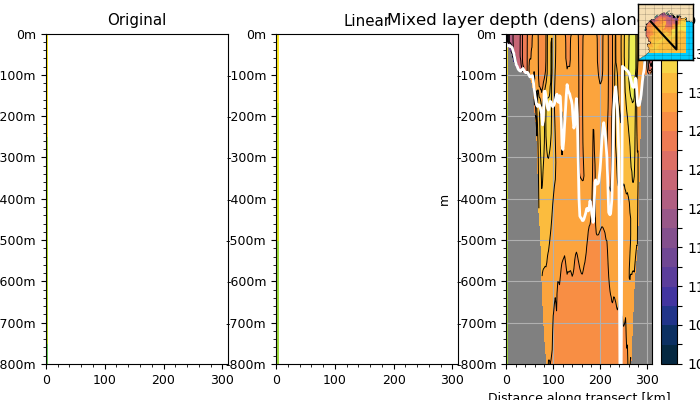
s = section2(xtemp, yaxis=xdepth, ymin=-800, fill='contourf', nmax=20,
contour_linewidths=0.7, bgcolor='0.5', figsize=(7,4),
cmap='thermal',
# cmap='vacumm_rnb2_hymex',
title='%(long_name)s (dens) along temp transect', show=False)
# Plot MLD
curve2(xmld, 'w-', linewidth=2, show=False)
# Add a small map to show the transect positions
add_map_lines(temp[-1], xlons, xlats, map_zoom=0.7, color='k', map_cmap='thermal')
# Save
figfile = code_file_name(ext='png')
if os.path.exists(figfile): os.remove(figfile)
s.savefig(figfile, pdf=True)