1.3.2.1. How to write a script
This tutorial shows how to write the same script with different level of coding.
In this example, we want to compute the mixed layer (MLD) depth from MARS3D outputs, and plot it on a map.
All these scripts produce a figure close to the one below.
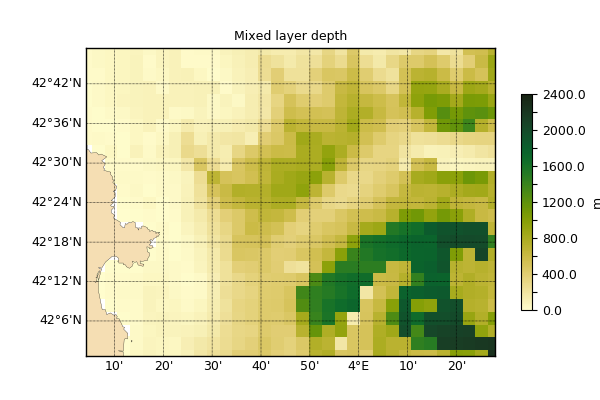
Figure created with the first level script. It shows the MARS3D MLD in the Gulf of Lion.
Note
We wont detail here how the algorithm for computing the MLD.
Please refer to the vacumm.diag.thermdyn.mixed_layer_depth()
for more information.
1.3.2.1.1. First level: simple case
In this example, we import all the needed functions for reading file, computing the MLD and plotting it. All parameterd are defined from within the script.
File: general.scripts.level1.py.
# Parameters
ncfile = "menor.nc"
lon=(3.,4.5)
lat=(42, 42.8)

# Imports
import cdms2
from vacumm.config import data_sample
from vacumm.diag.thermdyn import mixed_layer_depth
from vacumm.misc.plot import map2
from vacumm.data.misc.sigma import NcSigma
from vacumm.misc.grid import curv2rect

# Read temperature
print 'Read'
ncfile = data_sample(ncfile)
f = cdms2.open(ncfile)
temp = curv2rect(f('TEMP'))(lon=lon,  lat=lat,  squeeze=1)

# Compute depth
print 'depth'
s = NcSigma.factory(f)
depth = curv2rect(s())(lon=lon,  lat=lat, squeeze=1)
f.close()

# Compute MLD
print 'mld'
print temp.shape, depth.shape
mld = mixed_layer_depth(temp, depth, mode='deltatemp', deltatemp=0.1)

# Plot
print 'plot'
map2(mld, proj='merc', figsize=(6, 4), autoresize=0,
    fill='pcolormesh',  contour=False, show=False,
    colorbar_shrink=0.7, right=1, savefigs=__file__, close=True)


print 'Done'
1.3.2.1.2. Second level: using a child of Dataset class
Most of the operations of the first level script are directly integrated
in the children of the Dataset class,
and in particular in the MARS3D class.
This new formulation of the script takes advantage of this.
File: general.scripts.level2a.py.
# Parameters
ncfile = "menor.nc"
lon=(3.,4.5)
lat=(42, 42.8)

# Imports
from vcmq import DS, map2, data_sample
from vacumm.diag.thermdyn import mixed_layer_depth

# Read temperature and depth
ncfile = data_sample(ncfile)
ds = DS(ncfile, 'mars', lon=lon, lat=lat)
temp = ds.get_temp(squeeze=1)
depth = ds.get_depth(squeeze=1)

# Compute MLD
mld = mixed_layer_depth(temp, depth, mode='deltatemp')

# Plot
map2(mld, proj='merc', figsize=(6, 6), autoresize=0,
    colorbar_shrink=0.7, right=1, savefigs=__file__, show=False,
    close=True)


print 'Done'
In this the follwing formulation of the script, the mixed layer depth is also
directly computed by the MARS3D:
it automatically read the temperature and the depths before computing the MLD.
File: general.scripts.level2b.py.
# Parameters
ncfile = "menor.nc"
lon=(3.,4.5)
lat=(42, 42.8)

# Imports
from vcmq import DS, map2, data_sample

# Read temperature and depth
ncfile = data_sample(ncfile)
ds = DS(ncfile, 'mars', lon=lon, lat=lat)
mld = ds.get_mld(mode='deltatemp', squeeze=1)

# Plot
map2(mld, proj='merc', figsize=(6, 6), autoresize=0,
    colorbar_shrink=0.7, right=1, savefigs=__file__, show=False,
    close=True)


print 'Done'
1.3.2.1.3. Third level: add commandline arguments and options
We know want the script to be generic and use it without editing it.
Therefore we add options and arguments management using the argparse module.
File: general.scripts.level3.py.
#!/usr/bin/env python
"""Plot mixed layer depth from netcdf file"""

# Arguments
import argparse, os
parser = argparse.ArgumentParser(description=__doc__)
parser.add_argument("ncfile", help="model file", nargs="?",
    default="menor.nc")
parser.add_argument("-m", "--model", help="model type [default: %(default)s]",
    choices = ['ocean', 'mars', 'nemo'], default='mars')
parser.add_argument('-t', '--time', help='time selection, like \'("2000","2001","co")\'')
parser.add_argument('-x', '--lon', help='longitude selection, like \'(40,42)\'')
parser.add_argument('-y', '--lat', help='latitude selection, like \'(40,42)\'')
parser.add_argument('--title', help='alternative title')
parser.add_argument('--fillmode', help='fill mode [default: %(default)s]',
    choices=['nofill', 'pcolormesh', 'contourf'], default='contourf')
parser.add_argument('--disp', help='display the figure', action='store_true')
parser.add_argument('-o', '--outputfig', help='file name for output figure')
options = parser.parse_args()

# Check arguments
select = {}
for selname in 'lon', 'lat', 'time':
    val = getattr(options, selname)
    if val is not None:
        try:
            lon = eval(options.lon)
        except:
            parser.error('--%s: wrong argument'%selname)
    select[selname] = val

# Imports
from vcmq import DS, map2, MV2, data_sample

# The file
ncfile = options.ncfile
if not os.path.exists(ncfile):
    ncfile = data_sample(ncfile)
if not os.path.exists(ncfile):
    parser.error('File not found: '+ncfile)

# Read temperature and depth
ds = DS(ncfile, options.model, **select)
mld = ds.get_mld(mode='deltatemp', squeeze=1)

# Time average (if needed)
if mld.ndim==3:
    mld = MV2.average(mld, axis=0)

# Plot
map2(mld, proj='merc', figsize=(6, 6), autoresize=0,
    title=options.title, colorbar_shrink=0.7, right=1,
    show=options.disp, savefig=options.outputfig, savefig_verbose=True,
    close=True)