1.3.3.6.3.2.3. D’une grille curvilinéaire vers une grille rectangulaire
Voir : “Interpolation vers grille régulière” regrid2d() add_grid()griddata() krigdata() scrip() SCRIP.
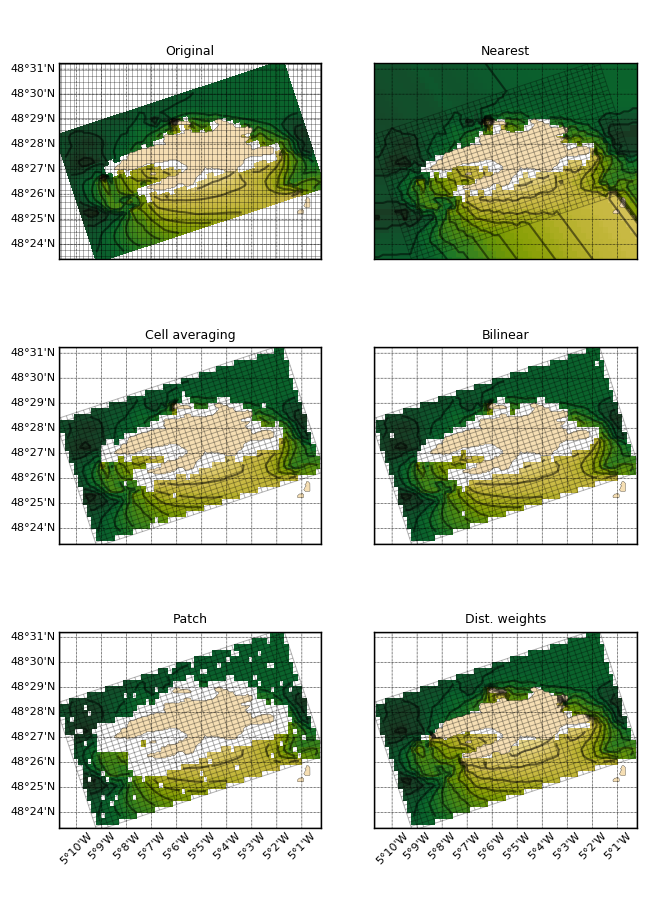
Regrillage d’une grille curvilinéaire (SWAN) vers une grille rectangulaire, par plusieurs méthodes.
# -*- coding: utf8 -*-
from vcmq import *

# Read data
zone = dict(yc=slice(0, 40), xc=slice(10, 40))
f = cdms2.open(data_sample('swan.four.nc'))
hs = f('HS', squeeze=1, **zone)
dlon = float(f.longitude_resolution)
dlat = float(f.latitude_resolution)
f.close()
cgrid = hs.getGrid()

# New rectangular grid
lon2d = cgrid.getLongitude()
lat2d = cgrid.getLatitude()
lon1d = create_lon(N.arange(lon2d.min(), lon2d.max()+dlon/2., dlon))
lat1d = create_lat(N.arange(lat2d.min(), lat2d.max()+dlat/2., dlat))
rgrid = cdms2.createRectGrid(lat1d, lon1d)

print 'Regridding'
print ' - nearest neighbours'
hs_nearest = regrid2d(hs, rgrid, method='nearest')
print ' - cell averages'
hs_cell = regrid2d(hs, rgrid, method='cellave')
print ' - bilinear'
hs_bilin = regrid2d(hs, rgrid, method='bilinear')
print ' - patch'
hs_pat = regrid2d(hs, rgrid, method='patch')
print ' - dstwgt'
hs_dst = regrid2d(hs, rgrid, method='dstwgt')

print 'Plots'
rc('font', size=11)
P.figure(figsize=(6.5, 9))
P.subplots_adjust(hspace=.22, bottom=.06, left=.09, right=.98, top=.95)
kwplot = dict(show=False, colorbar=False, vmin=hs.min(), vmax=hs.max(),
    xhide='auto', yhide='auto',
    drawparallels_size=8, drawmeridians_size=8, drawmeridians_rotation=45.)
m = map2(hs, title='Original', subplot=321, **kwplot)
add_grid(rgrid, lw=.7, alpha=.3)
map2(hs_nearest, title='Nearest', subplot=322,m=m,**kwplot)
add_grid(cgrid, lw=.7, alpha=.3)
map2(hs_cell, title='Cell averaging', subplot=323, m=m, **kwplot)
add_grid(cgrid, lw=.7, alpha=.3)
map2(hs_bilin, title='Bilinear',subplot=324, m=m, **kwplot)
add_grid(cgrid, lw=.7, alpha=.3)
map2(hs_pat, title='Patch', subplot=325, m=m, **kwplot)
add_grid(cgrid, lw=.7, alpha=.3)
map2(hs_dst, title='Dist. weights', subplot=326, m=m, **kwplot)
add_grid(cgrid, lw=.7, alpha=.3)
#m.show()
savefigs(code_base_name(ext='png'))
m.close()