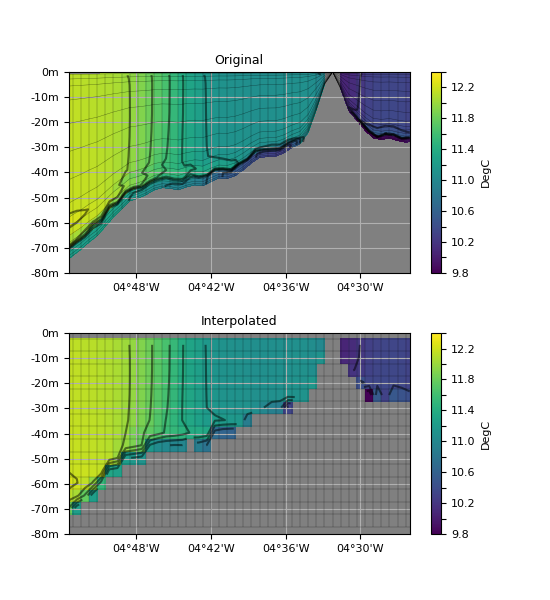
1.3.3.6.3.1.3. Regrillage 1D étendu
Voir : regrid1d() interp1d() cubic1d(), et le tutoriel “Interpolation 1D.

Interpolation linéaire sur selon un axe (vertical) dont les coordonnées varient selon 1 ou plusieurs des autres axes (zonal).
On fait alors appel aux mots clés xmap désignant les axes sur lesquels les coordonnées varient,
et xmapper pour spécifier ces coordonnées.
# -*- coding: utf-8 -*-
# Lecture de la temperature
import cdms2, MV2, numpy as N
from vacumm.config import data_sample
f =cdms2.open(data_sample('mars3d.xz.nc'))
t = f('temp', lon=(-4.9, -4.43))
h0 = f('h0', lon=(-4.9, -4.43)).filled(0.)
f.close()
t.long_name = 'Original'

# Creation d'un axe de profondeur
from vacumm.misc.axes import create_dep
ddep = 5.
dep = create_dep((-h0.max(),0.+ddep , ddep))

# Creation de l'axe etendu (taille (ndep,nx))
depths = -N.outer(t.getAxis(0)[::-1], h0)
dep[-1] = depths[-1].max()

# Regrillage lineaire
from vacumm.misc.grid.regridding import regrid1d
tr = regrid1d(t, dep, 'linear', axi=depths, axis=0)
tr.long_name = 'Interpolated'
t.getAxis(0).designateLevel()

# Plot
from vacumm.misc.plot import savefigs,yscale, add_grid, section2
import pylab as P
P.figure(figsize=(5.5, 6))
kwplot = dict(show=False, bgcolor='.5', ylim=(-80, 0))
# - original
section2(t, yaxis=depths, subplot=211, hspace=.3, **kwplot)
add_grid((t.getLongitude(), depths[:]), linewidth=.3)

# - regridded
section2(tr, subplot=212, **kwplot)
add_grid((tr.getLongitude(), dep[:]), linewidth=.3)
savefigs(__file__)
P.close()
