1.3.3.6.3.1.2. Remapping versus interpolation - 1D
Voir : regrid1d() interp1d() remap1d().

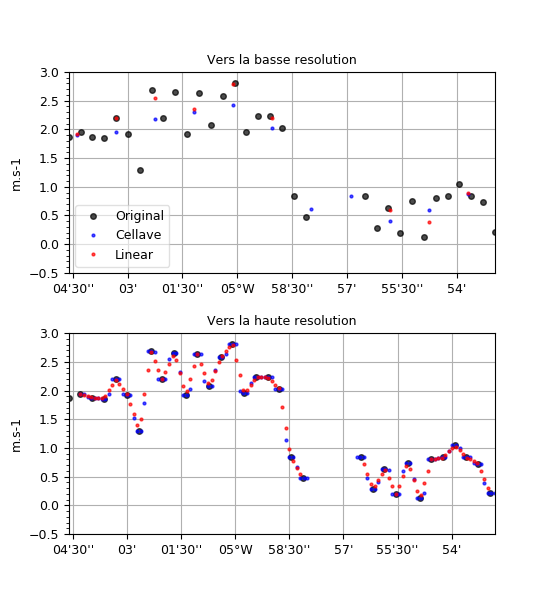
Un champ avec des valeurs manquantes sur un axes de temps basse résolution est interpolé vers un axe à plus haute résolution, par remapping et par interpolation linéaire.
# *-* coding: utf-8 *-*
# Lecture de la temperature
import cdms2, MV2, numpy as N
from vacumm.config import data_sample
f =cdms2.open(data_sample('mars3d.x.uv.nc'))
v = f('v', squeeze=1, lon=(-5.08, -4.88))
f.close()
v =  MV2.masked_values(v, 0.)
v.long_name = 'Original'

# On ajoute un peu de bruit
v[:] += N.random.random(len(v))

# Creation des deux axes de longitudes
from vacumm.misc.axes import create_lon
lon = v.getLongitude().getValue()
dlon = N.diff(lon).mean()
# - basse résolution
lon_lr = create_lon((lon.min()+dlon*.7, lon.max()+dlon, dlon*3.3))
# - haute résolution
lon_hr = create_lon((lon.min()+dlon, lon.max()+dlon, dlon/3.3))
# - dict
lons = dict(haute=lon_hr, basse=lon_lr)

# Regrillages et plots
from matplotlib import rcParams ; rcParams['font.size'] = 9
from vacumm.misc.grid.regridding import regrid1d
from vacumm.misc.plot import curve2,savefigs, yscale ; import pylab as P
P.figure(figsize=(5.5, 6))
kwplot = dict(show=False,vmin=v.min(),vmax=v.max(),alpha=.7)
for ilh,resdst  in enumerate(['basse', 'haute']):

    # Regrillage
    vlinear = regrid1d(v, lons[resdst], 'linear')
    vremap = regrid1d(v, lons[resdst], 'cellave')

    # Plots
    P.subplot(2, 1, ilh+1)
    curve2(v, 'o', markersize=4, color='k', label=u'Original', hspace=.3, **kwplot)
    curve2(vremap, 'o', markersize=2, label=u'Cellave', linewidth=1.2, color='b', **kwplot)
    curve2(vlinear, 'o', markersize=2, label=u'Linear', linewidth=1.2, color='r', **kwplot)
    yscale(1.1)
    P.title(u'Vers la %s resolution'%resdst)
    if not ilh: P.legend(loc='lower left').legendPatch.set_alpha(.6)

savefigs(__file__, pdf=True)
P.close()
