1.3.3.5.2.1. Tracé de cartes
Voir : map2().
Une carte de base.
from vcmq import data_sample, map, cdms2
# Read
import cdms2
f = cdms2.open(data_sample('mars3d.xy.nc'))
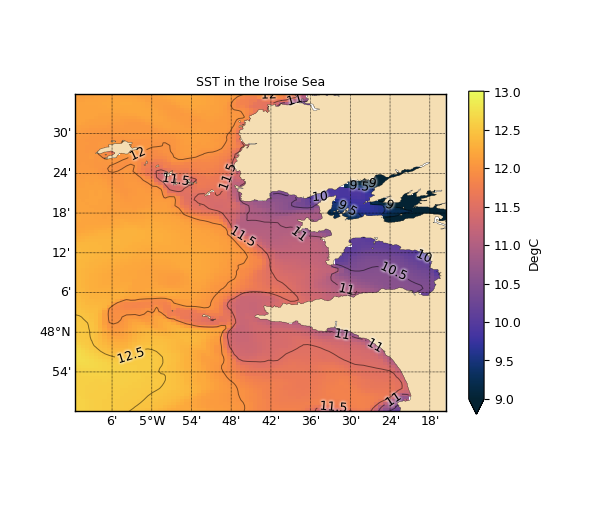
sst = f('temp', time=slice(0, 1), lat=(47.8, 48.6), lon=(-5.2, -4.25), squeeze=1)
f.close()
# Plot
m = map(sst, title='SST in the Iroise Sea', linewidth=.7,
fill='pcolormesh', cmap='cmocean_thermal', clabel=True,
vmin=9, top=.9, figsize=(6, 5), clabel_glow=True, clabel_glow_alpha=.4,
colorbar_shrink=.8, show=False, savefigs=__file__, close=True)