1.5.1. Basis of the librairy
1.5.1.1. General architecture
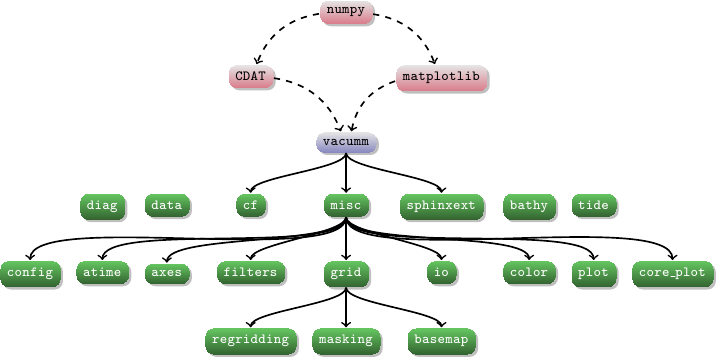
Schematic view of (most of) the library modules (in green) and of some required external modules (in red).
The library is organised as follow:
misc: Generic place where to put what cannot be placed elsewhere.axes: Utilities about CDAT axes.atime: Working with time.color: Working with colors and colorbars (matplotlib).config: Managing advanced configuration (configobj).filters: 1D et 2D filters.plot: Plot functions.stats: Special statistical functions.grid: About CDAT grids.phys: About physics.data: Advanced interfaces to datasets.diag: Advanced diagnostics.
1.5.1.2. CDAT as numeric basis
The choice was made to take CDAT as the basis for all library developments.
1.5.1.2.1. Array as extended variables [MV2]
The numerical vectors used are generated by the module MV2 (cdms2) of CDAT,
if they represent a quantity located in space and/or time.
These tables are not purely numerical and contain in particular:
- numerical values,
- the associated mask,
- the axes (1D or 2D) that locate the variable (longitude, time…),
- attributes (name, units…).
The advantage is that you do not have to pass explicitly and separately to the functions all this information in addition to the numerical vector. In addition, these “extended” tables are associated with a large number of functionalities developed by CDAT, adapted to an oceanographic and meteorological framework. Finally, let’s note that CDAT is an excellent interface for reading and writing netcdf files.
Consequently, reading and drawing a map will be done for example as follows:
>>> import cdms2
>>> f = cdms2.open('file.nc')
>>> sst = f('sst') # Lecture
>>> f.close()
>>> from vacumm.misc.plot import map
>>> map(sst) # Plot
1.5.1.2.2. The time [cdtime]
The time in the sense of the module cdtime of CDAT allows to manage
several types of calendar, consider absolute times (year, month, etc.)
or relative (number and units since a given date)
with no age limit,
and to integrate naturally in the variables MV2 to
across time axes.
This is the type of time used as the basis in the library.
Nevertheless, many functions (see atime)
allow conversions to be made to other
time types (string, numeric, datetime.datetime, etc).
1.5.1.3. Matplotlib as graphic basis
The library is based almost exclusively on Matplotlib and Basemap for all graphics. Matplotlib is a library allowing to make representations digital data graphics, in an environment close to Matlab. The graphics generated are of excellent quality, and are potentially available in many formats.
The module vacumm.misc.plot merges CDAT and matplotlib.
It contains a set of functions taking as argument CDAT variables.