Note
This script is sligthly obsolete and must be updated to be able to work with other model outputs, and renamed.
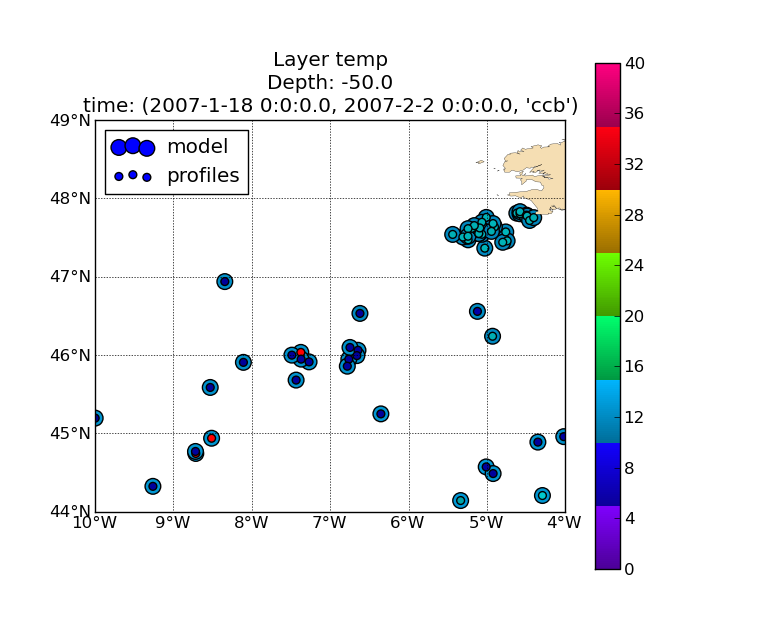
1.6.3.7. layer.py
Il s’agit du script permettant la visualisation d’un champs de données à une certaine profondeur.
Ce script permet la visualisation conjointe de variables de données grillées (modèle,climatologie) et d’observation (profils in situ).
La description des données à représenter est définie par le fichier de configuration. Les options en ligne de commande (voir usage), sont aussi paramétrables dans le fichier de configuration.
Le script produit un tracé par intervalle de temps et par variable.
1.6.3.7.1. Usage
Usage: layer.py [options]

Produce horizontal layer plots

Options:
  --version             show program's version number and exit
  -h, --help            show this help message and exit
  --cfgfile=CFGFILE     Configuration file
  -v varname[,alias]*, --variables=varname[,alias]*
                        Variables to be processed. Use aliases when varname
                        differ between datasets. This option may be repeated
                        to produce figures for each variable definition.
  -t min,max,[bb],step,unit, --time=min,max,[bb],step,unit
                        Time selection: - min,max: specify the time range to
                        operate. - bb: optionnal, time bounds open/closed
                        selection. - step,unit: period covered by each plot.
                        Ex:  "2001-01,2001-01-15T00,7,days"
                        "2001-06,2001-09,co,1,month"
  -d depth, --depth=depth
                        Depth selection (m)
  -b lonmin,latmin,lonmax,latmax, --bbox=lonmin,latmin,lonmax,latmax
                        Restrict processed zone to the specified bounding box
  --coloc=COLOC         Use colocation method, one of ('nearest', 'interp'),
                        default is none)
  -o pattern, --output=pattern
                        Output files pattern (default:
                        layer-%(var)s-%(depth)s-%(tmin)s-%(tmax)s.png)
  --show                Show figures
1.6.3.7.2. Aperçu des sorties
Tracé d’une couche sans colocalisation:

Tracé d’une couche avec colocalisation par plus proche voisin:

Tracé d’une couche avec colocalisation par interpolation: