1.6.2.6. showbat.py – Plot the bathymetry in an area

Usage:
showbat.py [options] [ncfile]
Description:

Plot the bathymetry in an area. Value are considered negative under the sea and positive on land.

Options:
-h, --help

show this help message and exit

--xmin=XMIN, --x0=XMIN, --lonmin=XMIN

Min longitude

--xmax=XMAX, --x1=XMAX, --lonmax=XMAX

Max longitude

--ymin=YMIN, --y0=YMIN, --latmin=YMIN

Min latitude

--ymax=YMAX, --y1=YMAX, --latmax=YMAX

Max latitude

--ncfile=NCFILE

Name of netcdf file for a direct access [obsolete, use first argument instead]

-n NAME, --name=NAME

Name of bathymetry as stored in configuration file

-c CFGFILE, --cfgfile=CFGFILE

Name of bathymetry configuration file where to get info (file, names)

--varname=VARNAME

Name of the bathymetric netcdf variable

--lonname=LONNAME

Name of longitude axis

--latname=LATNAME

Name of latitude axis

-t TITLE, --title=TITLE

Title of the plot

--land

Do not hide land topography [default: False]

-r, --reverse

Reverse bathymetry [default: False]

--zmin=ZMIN, --z0=ZMIN

Minimal altitude (<0 under the sea, >0 on land)

--zmax=ZMAX, --z1=ZMAX

Maximal altitude (<0 under the sea, >0 on land)

--maxalt=MAXALT

Max altitude to plot (positive float)

--noshadow

Do not plot shadow for the relief

--clsize=CLSIZE

Size of contour labels [default: 8, 0 to turn off]

--clglow

Add glow to contour labels [default: False]

-o FIGNAME, --out=FIGNAME

Name of an output file where to store the plot

-s FIGSIZE, --figsize=FIGSIZE

Size of figure in inches, like “5,6” or simply “5”

--proj=PROJ

Map projection [default: merc]

--res=RES

Shoreline resolution [default: auto]

-f, --force

Don’t ask question

Examples:
$> showbat.py -s 8 --clglow -o showbat1.png
Please set min longitude (or use -f or --xmin options): -10
Please set max longitude (or use -f or --xmax options): -1
Please set min latitude (or use -f or --ymin options): 43
Please set max latitude (or use -f or --ymax options): 48
_images/showbat1.png

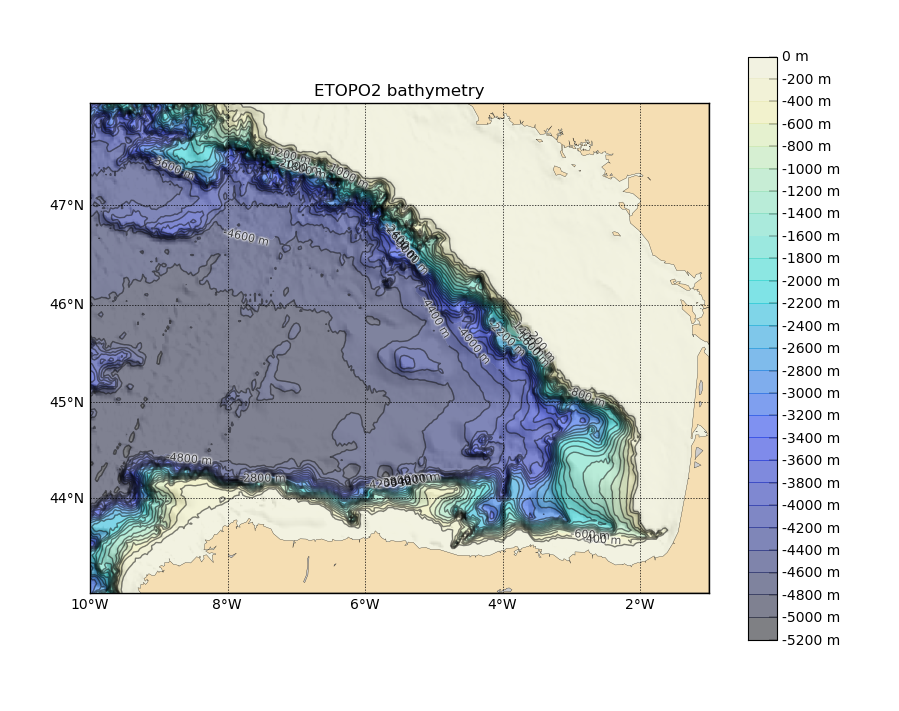
Figure created using the first example.

$> showbat.py --xmin=-7 --xmax=-3.5 --y0=46.5 --y1=49 \
--maxdep=200 --land -s 8 --clsize=0 -o showbat2.png
_images/showbat2.png

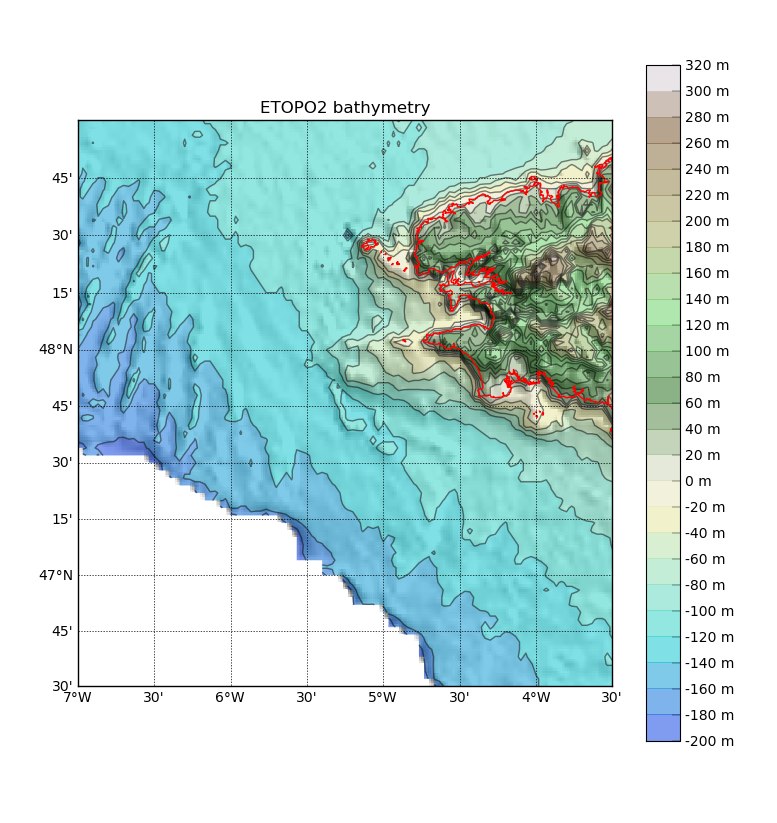
Figure created using the second example.

See also:

NcGriddedBathy, plot_bathy().