1.6.2.5. showmpi.py – Display the MPI decomposition domain
MPI decomposition information comes from a file tipically names mpi.txt.
| Usage: | showmpi.py [-h] [-q] [-t TITLE] [-a ALPHA] [-o OUTFIG] [-d]
marsfile mpifile
|
|---|---|
| Description: | Plot the MPI domain decomposition |
| Positional Arguments: | |
|
|
| Optional Arguments: | |
|
|
| Examples: | $> showmpi.py -o showmpi.png ../data/mpi.nc ../data/mpi.txt
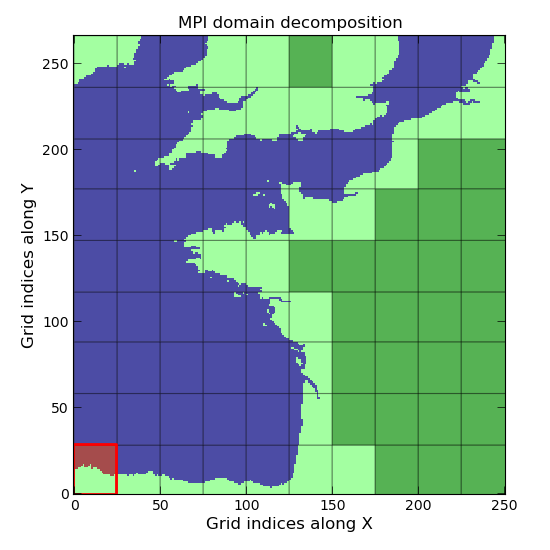
MPI blocks are plotted along indices over the model mask. Contour of MPI blocks containing inactive ocean points are in red. Inactive ocean points are also colored in red. |
| See also: | |