1.6.2.7. showbatsec.py – Plot section of bathymetry

Usage:
showbatsec.py [options] [ncfile]
Description:

Plot a section of bathymetry.

Options:
-h, --help

show this help message and exit

--x0=X0, --lon0=X0

Longitude of first point

--y0=Y0, --lat0=Y0

Latitude of first point

--x1=X1, --lon1=X1

Longitude of second point

--y1=Y1, --lat1=Y1

Latitude of second point

--ncfile=NCFILE

Name of netcdf file for a direct access [obsolete, use first argument instead]

-n NAME, --name=NAME

Name of bathymetry as stored in configuration file)

-c CFGFILE, --cfgfile=CFGFILE

Name of bathymetry configuration file where to get info (file, names)

--varname=VARNAME

Name of the bathymetric netcdf variable

--lonname=LONNAME

Name of longitude axis

--latname=LATNAME

Name of latitude axis

--along=ALONG

Along wich coordinates to plot: “lon”, “lat”, “m” (“m” or “km” or “dist”), “auto” [default: auto]

-t TITLE, --title=TITLE

Title of the plot

-r, --reverse

Reverse bathymetry [default: False]

--zmin=ZMIN

Min altitude to plot (negative under water)

--zmax=ZMAX

Max altitude to plot (negative under water)

--nomap

So add a small map of the transect situation

--mapscale=MAPSCALE

Rescale the map area [default: 2

-o FIGNAME, --out=FIGNAME

Name of an output file where to store the plot

-s FIGSIZE, --figsize=FIGSIZE

Size of figure in inches, like “5,6” or simply “5”

Examples:
$> showbatsec.py  -o showbatsec1.png
Please set longitude of first point: -7
Please set latitude of first point: 43
Please set longitude of second point: -1
Please set latitude of second point: 47
_images/showbatsec1.png

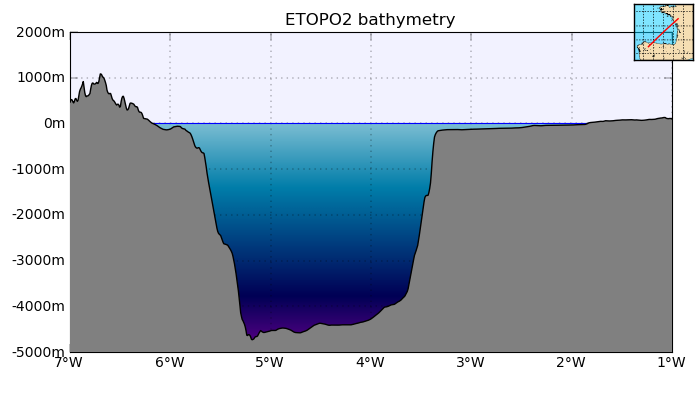
Figure created using the first example.

$> showbatsec.py  --x0=-2 --y0=44 --x1=-4 --y1=48 \
--along=m --title="Section across shelf" -o showbatsec2.png
_images/showbatsec2.png

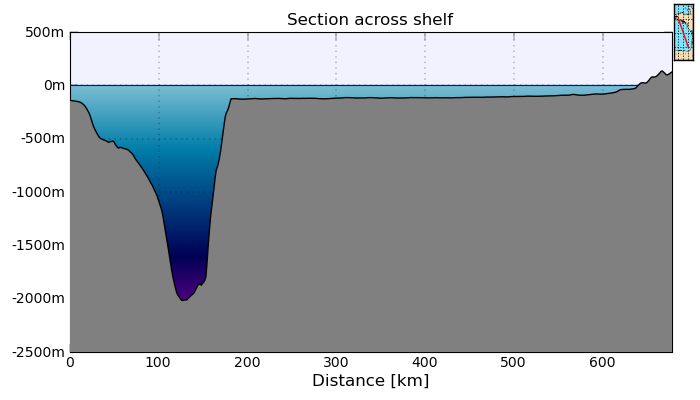
Figure created using the second example.

See also:

NcGriddedBathy, curve2(), minimap(), transect_specs().